
Pace and Run Style Analysis in UK Horse Racing
 Available in US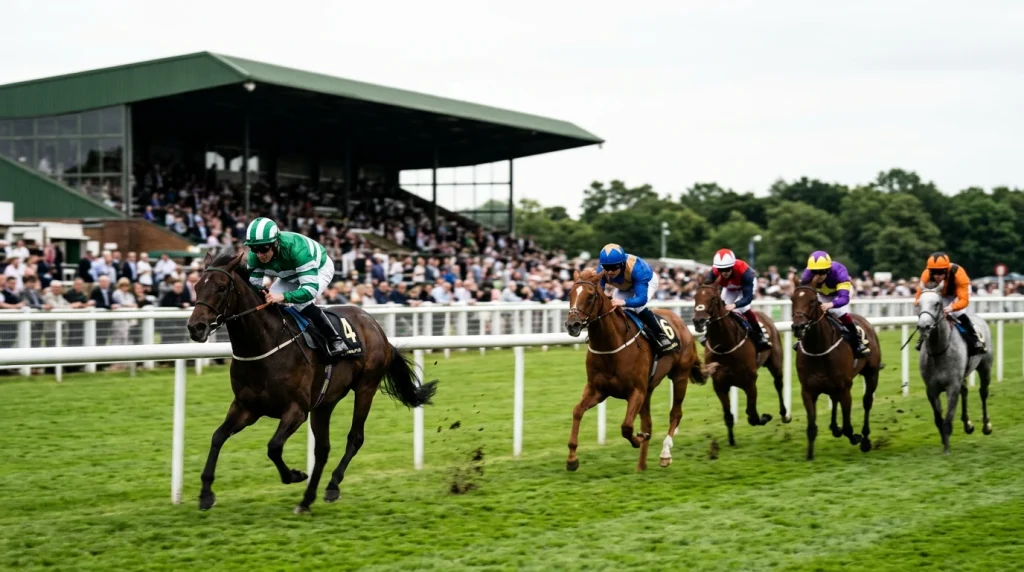
Analyzing Pace Scenarios and Run Styles
The single biggest improvement I have ever made to my Saturday work was the day I stopped looking at the odds first. Before I open the price column on a race, I build a pace map. Who is the most likely front-runner? Who is going to be in the first three off the gate? Who is held up at the back? The answers to those three questions shape almost every other read I do on the race — and on UK courses with short straights and soft ground, the answers are routinely mispriced by the market.
Pace analysis travels from American racing, where speed figures and run-style classifications have been a public discipline for decades. In the UK we have been slower to adopt it as a structured tool. That gap is exactly why it pays. Bookmakers run sophisticated models, but the pace component of those models is rougher than the rest because pace data is harder to systematise and the variables shift with the field. This piece walks through how I build a pace map, how track shape changes the read, where draw and pace interact, and how I use the whole framework as a filter before I look at a single price.
The Four Run Styles and How to Spot Them
Every horse in a race falls into one of four run-style categories: front-runner, prominent, mid-division, or hold-up. The categories are about where the horse positions itself in the first quarter of the race, not where it finishes. A front-runner takes the lead within the opening furlong and tries to hold it. A prominent racer settles in the first three or four, just off the leader. A mid-division horse races in the middle of the pack. A hold-up horse settles at the back and relies on closing pace to win.
Classifying run style from form figures alone takes practice but is mechanical once you know what to look for. The Racing Post’s in-running comments tell you where the horse was at each stage of the race — “led”, “tracked leaders”, “mid-division”, “held up” — and three consecutive runs with similar comments establish a reliable pattern. I do not trust a single run; the same horse can race differently depending on the field, the gate and the jockey’s instructions. Three runs in a row settles the read.
The category that gives away most market value is the genuine, confirmed front-runner. There are fewer of them than the public thinks, because most horses described as “leading” in a particular race were just the fastest into stride that day. A horse that has led from the gate in five of his last seven races is a confirmed front-runner; a horse that led once and was prominent four times is a prominent racer, not a front-runner. The distinction matters because a race with one confirmed front-runner sets up entirely differently from a race with three.
Building a Pace Map for a Saturday Card
The pace map is a one-line summary of how the race is likely to unfold. I write mine in a notebook, by hand, race by race. The format is simple — list the runners by likely position in the first quarter of the race. A typical pace map for a competitive twelve-runner handicap might read: “Stall 4 leads, stalls 7 and 11 sit prominent, six in the mid-pack, three held up.”
To build the map I look at three inputs. First, the in-running comments from each horse’s last three races, which give me the run-style classification. Second, the draw, which adjusts the read for whether the horse can hold its preferred position from the stalls assigned. Third, the jockey instructions where they are publicly known — some jockeys are famous for pressing the pace, some for hold-up tactics, and that style often dictates how a borderline-prominent horse will be ridden.
The map only takes about three minutes per race once you have the form figures open, but it changes everything that follows. A race with one confirmed front-runner who jumps from a low draw is a different proposition from a race with three speed horses fighting for the lead. The first sets up a controlled pace that benefits the leader. The second sets up a hot pace that benefits closers. The market often does not differentiate between the two scenarios because the price column does not have a pace column next to it. Your pace map gives you information the bookmakers’ aggregate price has only partially captured.
The discipline I keep is to write the map before opening the price column. If I see the prices first, I anchor on them and tend to read the pace map to fit the favourite. Doing the work blind protects the read.
How Track Shape Reshapes Everything
Track shape is the variable that turns a pace map from a theory into a profit angle. UK courses are unusually varied — tight, undulating, left-handed, right-handed, sharp-bend, galloping, flat — and each shape rewards a different run style. The same horse profile pays you on one course and costs you on another.
The cleanest example is the tight-bend sprint. On UK courses with very tight final bends — Chester, Beverley, parts of Catterick — a low draw combined with a front-running profile is structurally favoured. Across UK sprints on tight-bend tracks, low-drawn horses win around twenty-eight per cent of races, which is well above the field-average expectation given typical stall numbers. The bias is so pronounced at venues like Chester that the bookmakers price it in to some extent, but they do not price it perfectly — there are spots where the front-runner from stall one drifts to 4/1 in a race where the model says fair price is closer to 5/2.
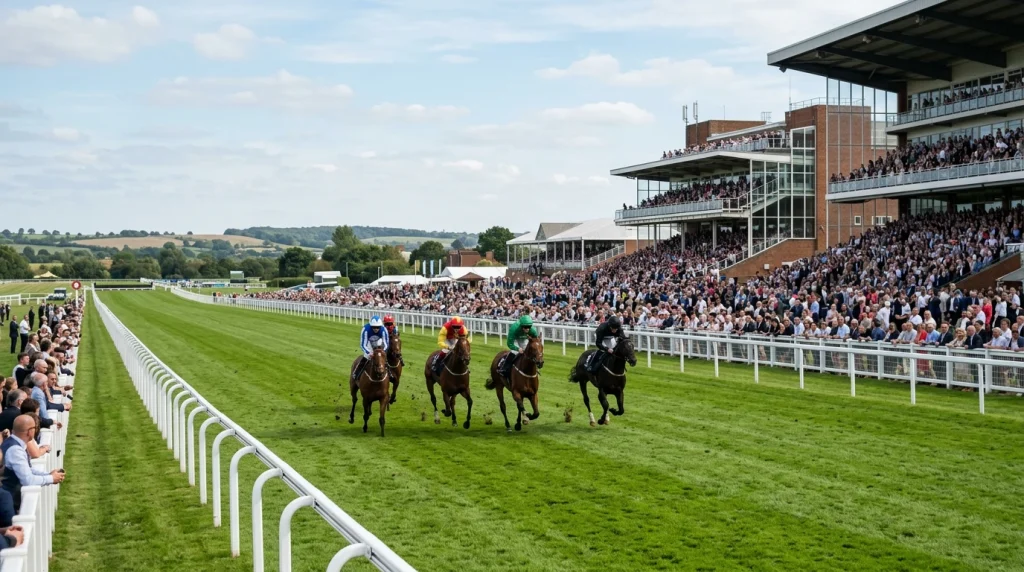
Galloping tracks reward a different profile. At Newmarket’s mile course and at Doncaster, the long straights give closers time to wind up their finishing pace. A pure hold-up horse who would be lost on a Chester half-miler can win comfortably at Doncaster on the same OR. Reading the track shape first and then matching run styles to the geometry is the foundation under every pace-driven bet. The mechanics of how draw interacts with the pace map sit in my piece on draw bias on UK racecourses, which walks through the specific tracks where stall number does most of the work.
Pace and Draw Interact More Than Either Works Alone
The trap that catches new pace punters is treating pace and draw as separate variables. They are not. A confirmed front-runner from a high draw at Chester is a worse bet than a prominent horse from a low draw, because the front-runner cannot get to the rail before the bend and ends up boxed wide. Conversely, a hold-up horse from a low draw in a five-furlong sprint is a worse bet than a hold-up horse from a high draw, because the held-up horse from the inside is going to find no clear running path through the field.
The two-variable read goes like this. List the run style of each horse. Overlay the draw. Adjust the run style category based on whether the draw supports the natural style or fights it. A confirmed front-runner from stall two in a five-furlong sprint on a tight track is upgraded. A confirmed front-runner from stall fourteen in the same race is downgraded — he is likely to be pushed wide and is unlikely to hold the lead from outside. By the time you have done this for the twelve or fourteen runners, you have a pace map that integrates both pieces of structural information, and the price gaps become obvious.
Using Pace as a Filter, Not a Bet
The way to lose money with pace analysis is to bet every front-runner because the map looks favourable. The map is a filter on top of a value model, not a bet trigger on its own. The reference point I keep is that forty-three of every forty-eight competitive race winners come from the top five in the market. If the pace map points at the favourite, you are likely making a routine bet at routine value. If the pace map points at a horse outside the top five, you had better have other reasons to like the horse — a yard with strong destination-track form, a clear class drop, a working jockey-trainer pair — or the price is wide for a reason.
The pace setup is at its most useful when it confirms or contradicts a value read I already have. If my model likes a horse at 8/1 and the pace map suggests he is in a soft setup, that is a bet I make with confidence. If my model likes a horse at 8/1 but the pace map suggests he is going to be in a three-way speed duel, that is a bet I downgrade to “watch only” and revisit when the race form has run.
Reading the Race Before the Race Starts
The deepest reward from pace analysis is psychological. By the time the stalls open, I have already imagined how the race will unfold. I know who will be in front, who will be tracking, where the trouble is likely to come from, and what the key moment is — usually the run to the final bend on UK courses with short straights. Watching the race live is then a question of seeing whether reality conforms to the map. When it does, I have evidence the model is working. When it doesn’t, I have evidence to update the next map. Done over a season, this discipline builds the kind of intuitive race-reading skill that no amount of staring at the prices will ever produce — because the prices tell you what the market thinks, while the pace map tells you what is actually about to happen on the track.
Articles and Strategies

Created by the "FurlongLab" editorial team.
